No Data Alerts for Groups in SigNoz
Overview
This document descibes how to use alerting feature to detect when specific groups of resources/entities stop sending data. While the basic "No Data" option notifies you when there's no data at all, this advanced feature allows you to monitor individual groups (like specific hosts, services, or regions) and get alerted when any particular group stops reporting metrics.
Understanding Group-Based No Data Alerts
When to Use This Feature
This feature is particularly useful when you have:
- Multiple hosts reporting metrics, and you need to know if any specific host goes down
- Services distributed across regions, and you want to detect regional outages
- Applications with multiple instances where individual instance failures matter
- Any scenario where you're grouping data by one or more attributes
How It Works
The alert uses a time-shift comparison to detect missing data:
- It compares the current data with data from X minutes ago (example 10 minutes ago)
- If a group was reporting data X minutes ago but isn't reporting now, the comparison yields zero
- When this zero state persists for the entire evaluation period, an alert is triggered
Setting Up a Group-Based No Data Alert
Let's walk through setting up an alert that notifies you when a specific host stops sending CPU utilization data.
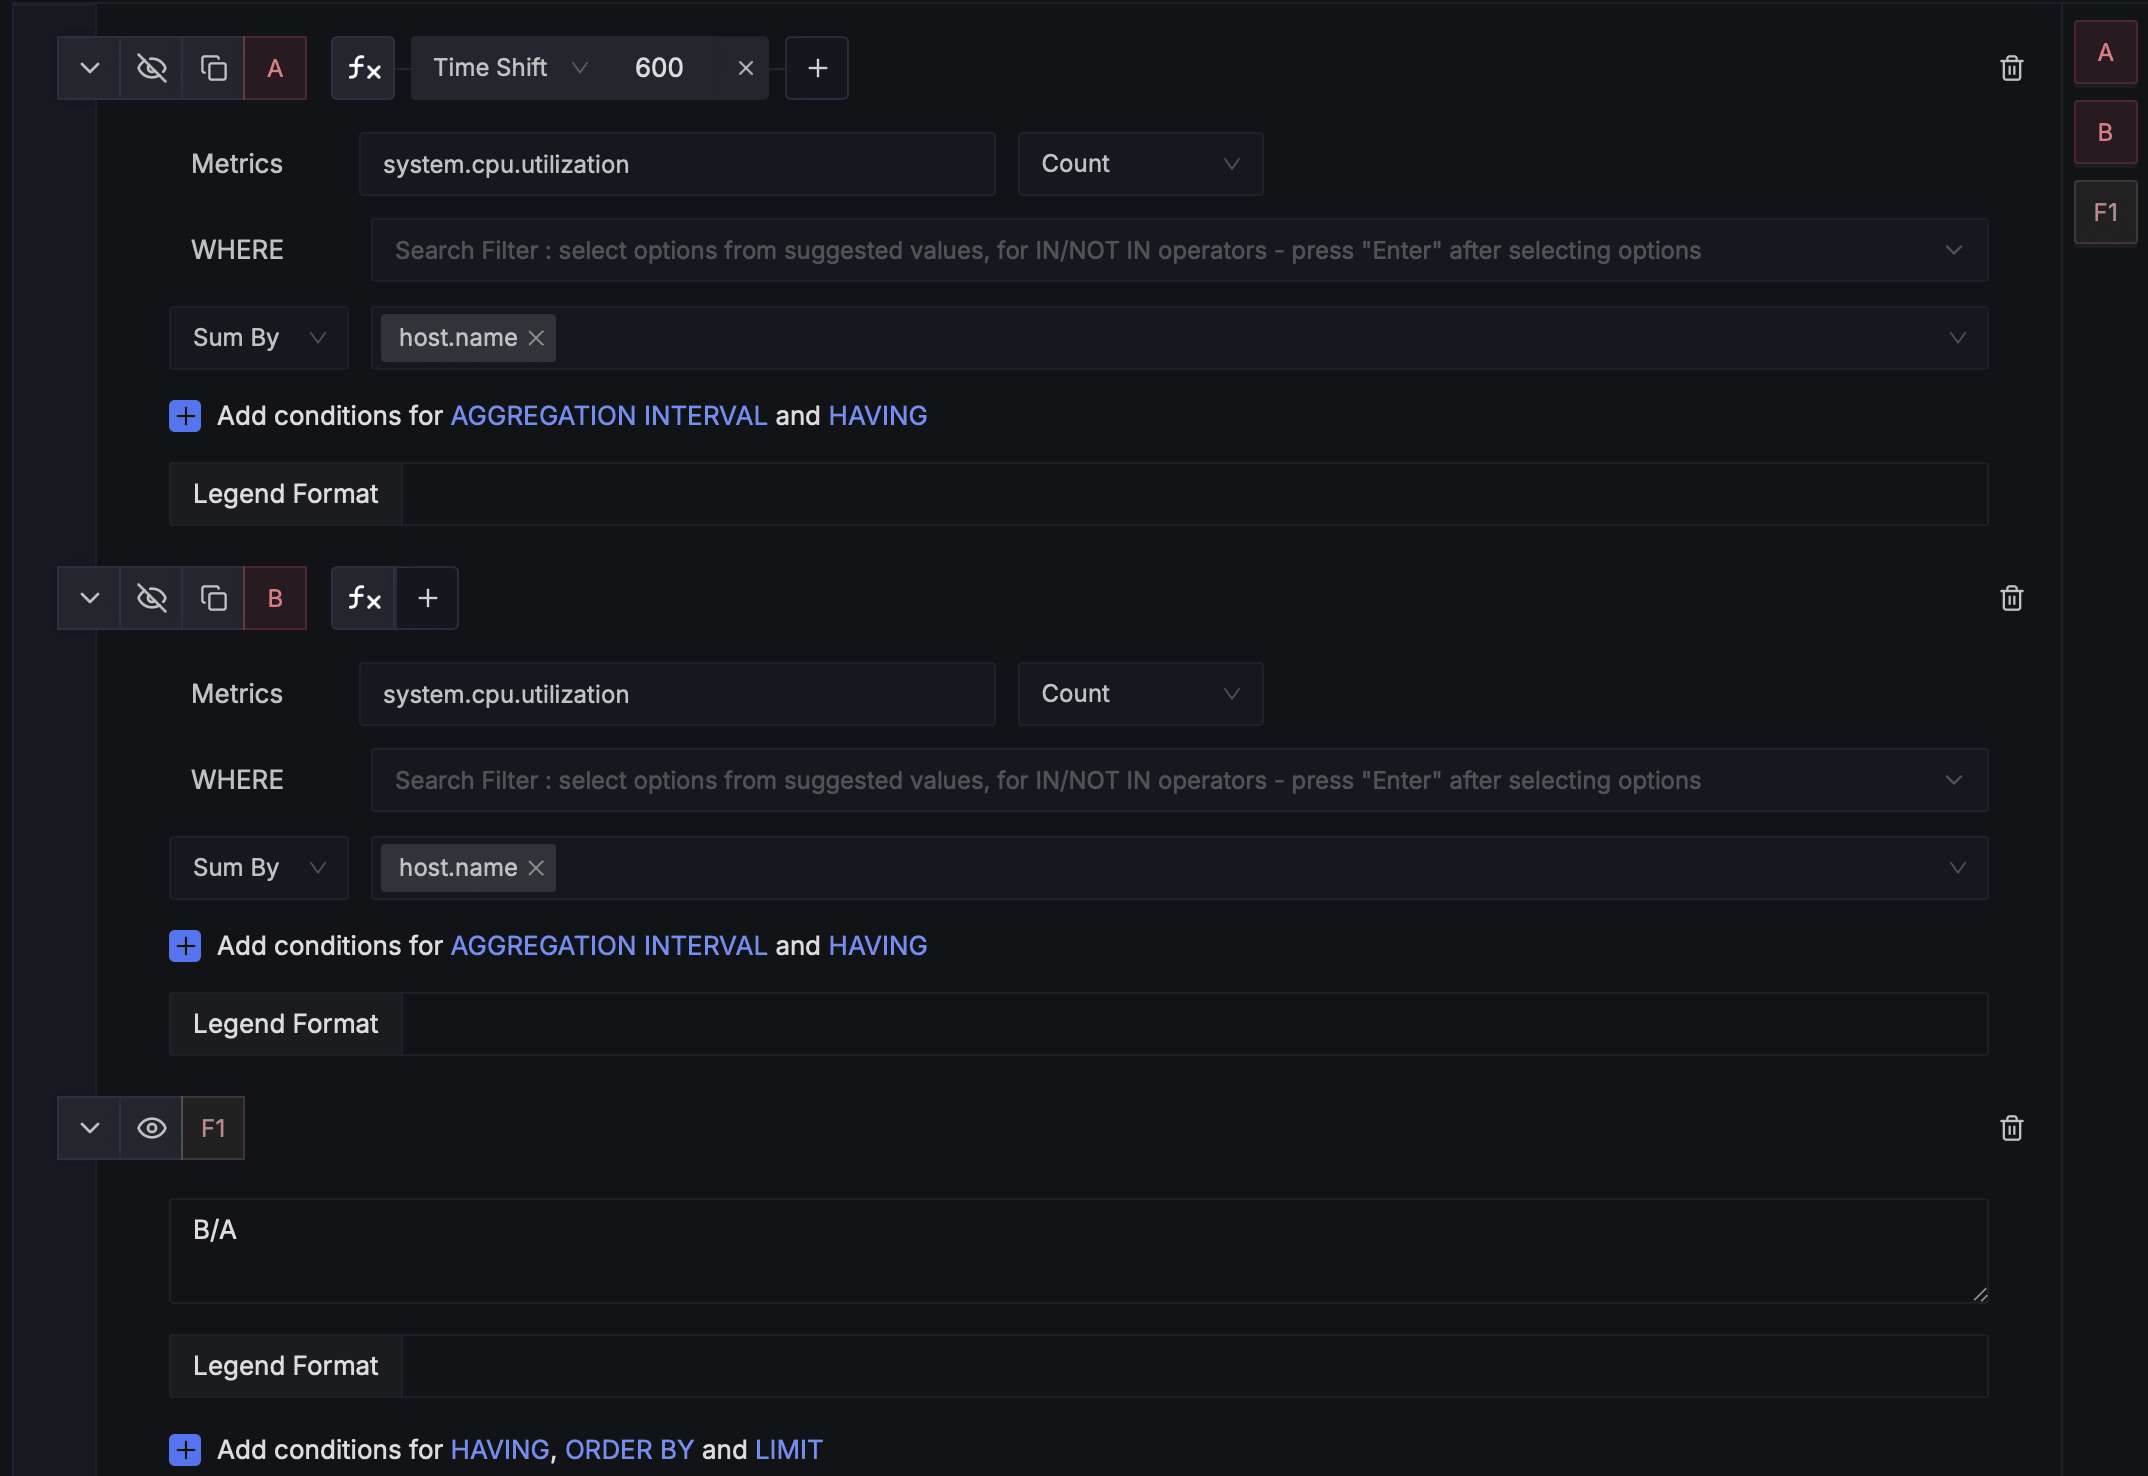
Step 1: Configure the Query
Select your metric: Choose system.cpu.utilization Set aggregation: Select Count as the aggregation method Group by host: In the "Sum By" field, select host.name
Step 2: Add Time-Shift Conditions
Click on the F(x) option next to Query name and add Time shift function. Enter the value in seconds. Example 600s for last 10 minutes.
Step 3: Create a new Query
Create a exactly same query but without timeshift
Step 4: Create the Formula
Use the expression B/A
Step 5: Configure Alert Conditions
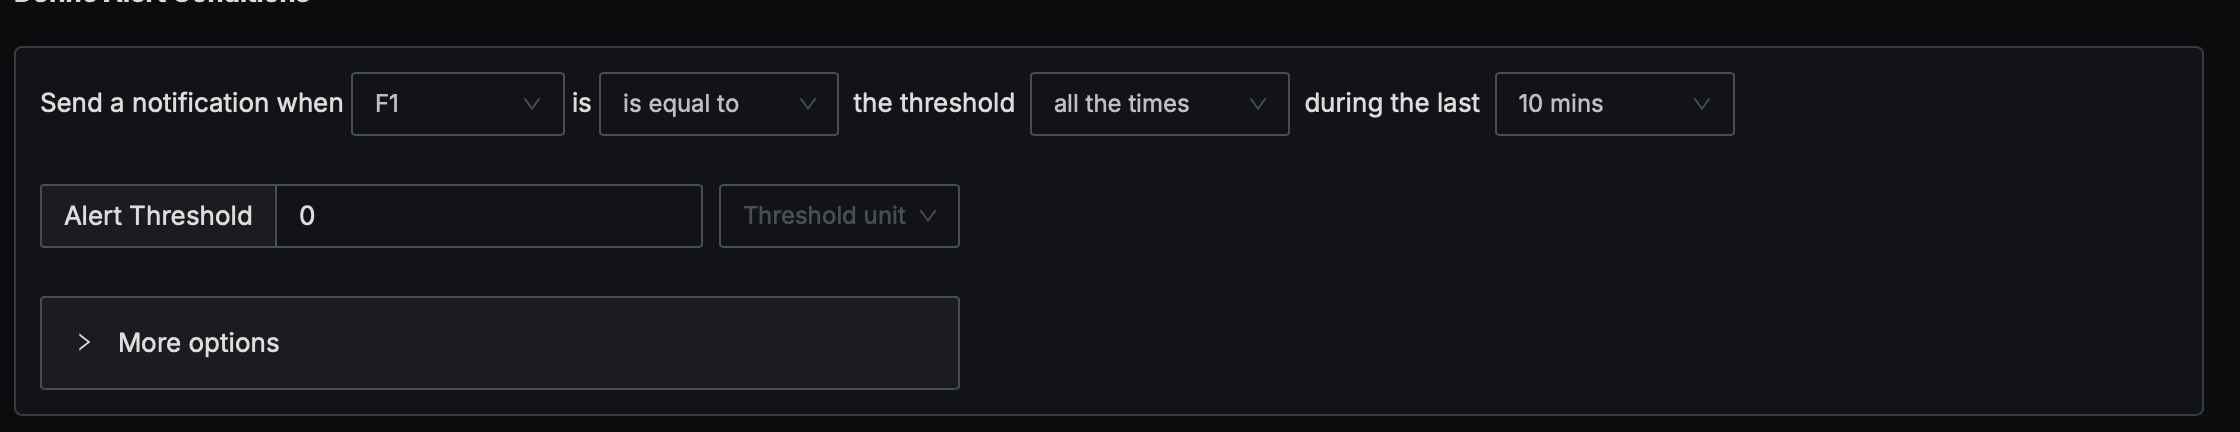
Set up the alert to trigger when the formula equals zero:
- Condition: Set to "is equal to"
- Threshold: Enter 0
- Evaluation: Select "all the times" to ensure the condition is met consistently
- Duration: Choose your evaluation window (e.g., "10 mins"), should be same as the timeshift duration
Multi-Attribute Grouping
You can group by multiple attributes for more granular monitoring:
- Group by host.name AND service.name to monitor specific services on specific hosts
- Group by region AND availability_zone for cloud infrastructure monitoring
